Understand iPhone Battery Graph: What Does it All Mean
Learn how to read and interpret the detailed battery graph on your iPhone, find out apps causing battery drain, and optimize battery life.
Apple has taken several steps to make it easier for users to understand the battery life of their iPhones. Users can check their iPhone’s battery health and even enable the Optimized Battery Charging feature to prolong the battery life of their iPhones.
Apple also introduced a detailed battery graph feature that gives users a detailed representation of their iPhone battery usage statistics. That said, the iPhone battery graph can be a bit confusing to understand.
With this guide, we aim to solve this issue. By the end of this guide, you will learn how to read your iPhone’s battery graph and find out the apps causing the most battery drain. So, without further ado, let’s get started.
- Where to find the iPhone battery statistics graph
- How to make sense of the iPhone battery graph
- Prolong the battery life of your iPhone
Where to find the iPhone battery statistics graph
The first step to understanding the battery graph on your iPhone is to find it.
1. Launch the Settings app on your iPhone and open the Battery settings.
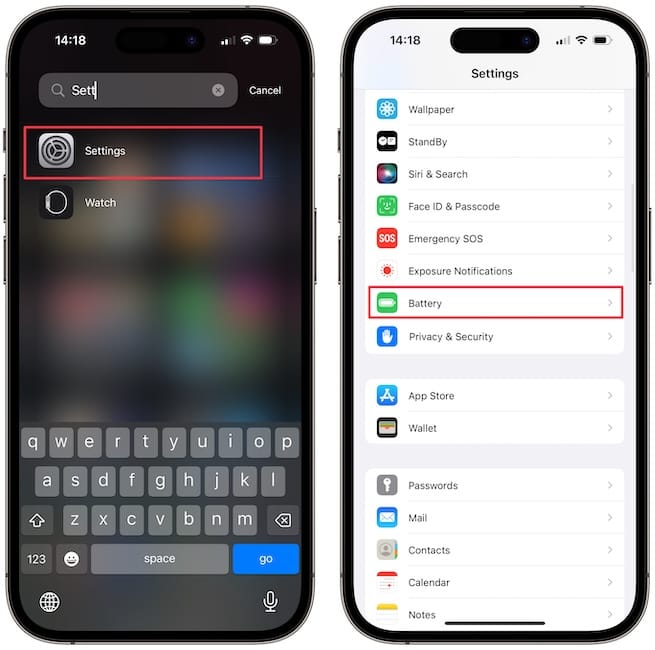
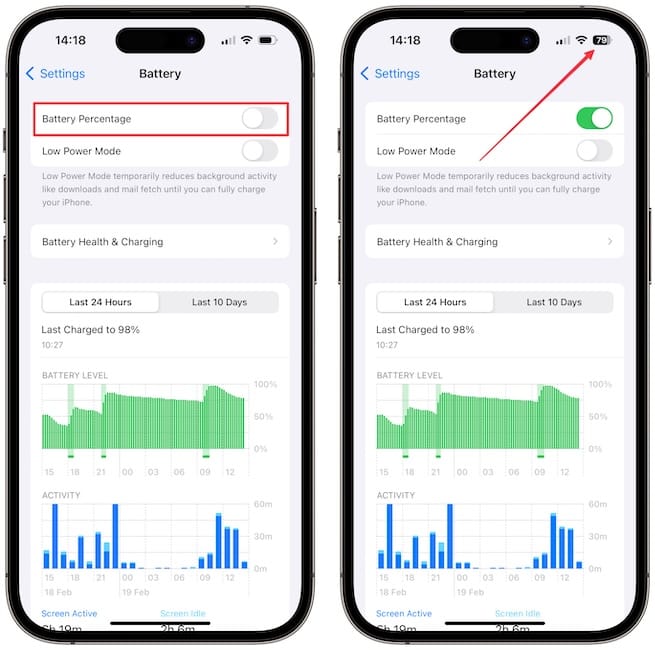
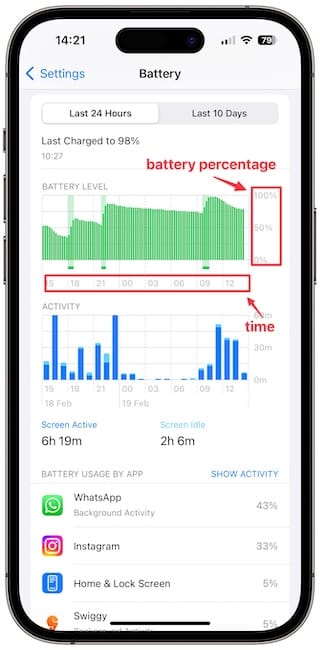
2. On this page, you can see the detailed battery usage graph of your device. We recommend enabling the Battery Percentage toggle so you can see your iPhone’s battery percentage in the battery icon.
Now, let’s see how you can read the battery graph of your iPhone.
How to make sense of the iPhone battery graph
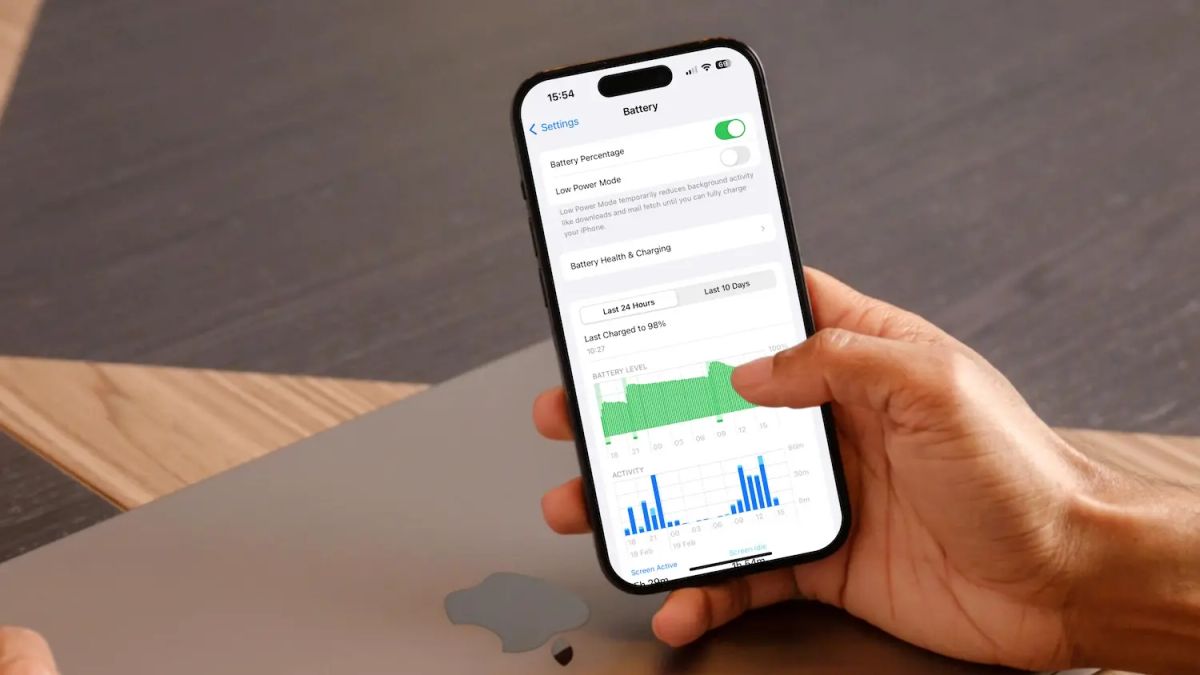
The first thing you will notice is the Battery Level bar graph. The bar graph is color-coded with dark green and light green colors. The dark green color represents the time your iPhone was plugged in and charging, while the light green color denotes when the iPhone was running on battery.
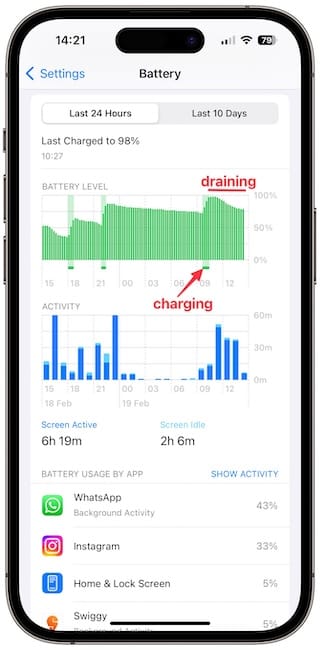
The X-axis of the graph shows the time, while the Y-axis shows the battery percentage. You can see that my iPhone was charging at 9AM and draining afterwards.
Below the battery level graph is the Activity graph. As the name suggests, this graph tracks and displays your iPhone’s activity. It’s divided into two metrics: the Screen Active and Screen Idle. The Screen Active metrics show how long you actively used your iPhone in the last 24 hours, while the Screen Idle metrics display the time when your iPhone used battery in the background.
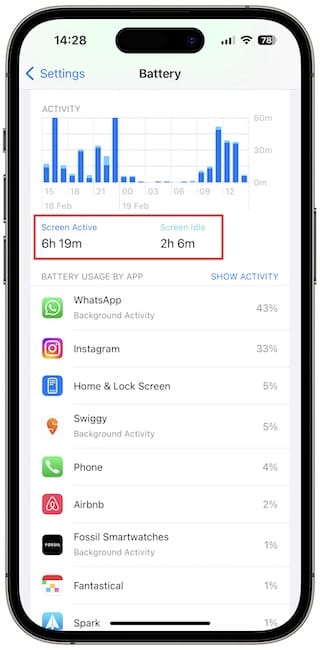
You can see both these metrics represented in the Activity graph with dark blue and light blue colors. Each bar of the graph represents one hour. You can tap on a bar to see the amount of battery drain in that hour. Tap the graph again to open the full view again.
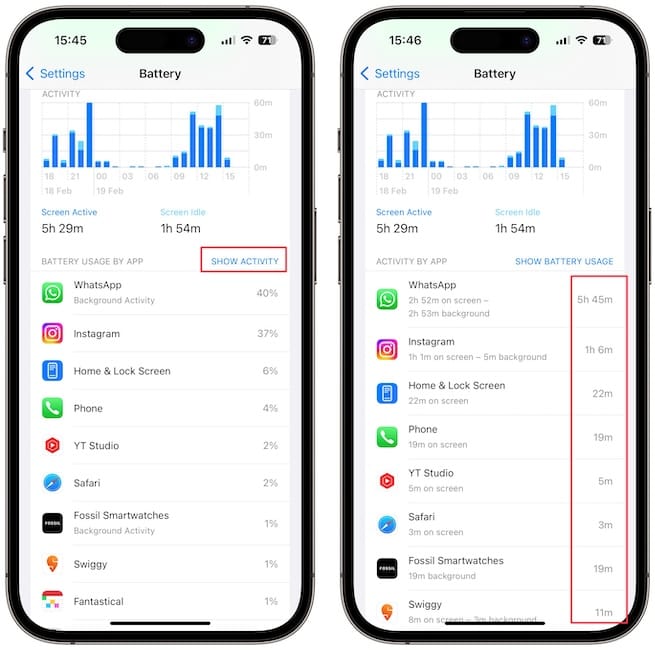
Below these metrics, you can see the battery usage on a per-app basis. You can tap the Show Activity button to see the app used by time. I like that the system also shows us on-screen and background activities for each app.
Understanding the Last 10 Days graph
Till now, we were in the Last 24 Hours section of the graph. You will notice that there’s also a Last 10 Days section. Tapping on it will reveal the battery usage of your iPhone in the last 10 days.
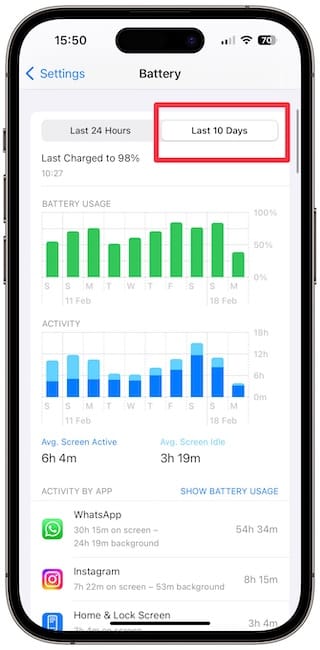
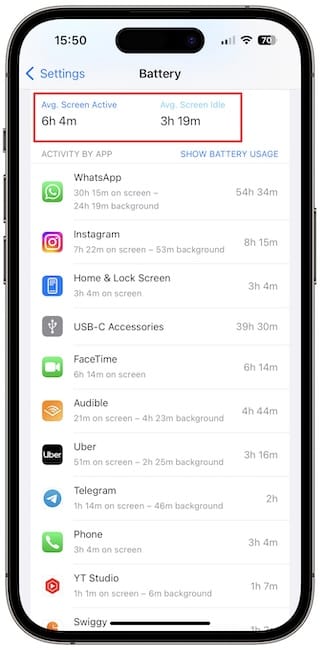
The Battery Usage graph shows the amount of battery your iPhone uses on any given day. You can also see the average screen on time and idle time for the past 10 days, along with battery usage statistics per app basis.
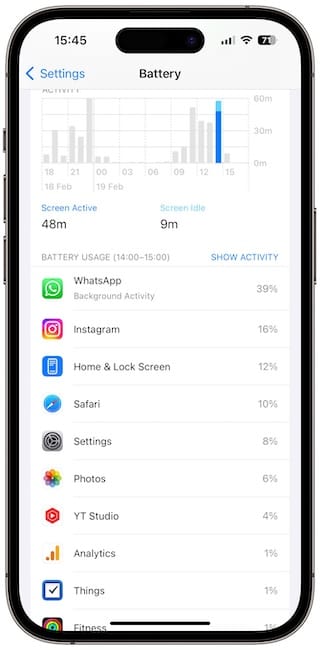
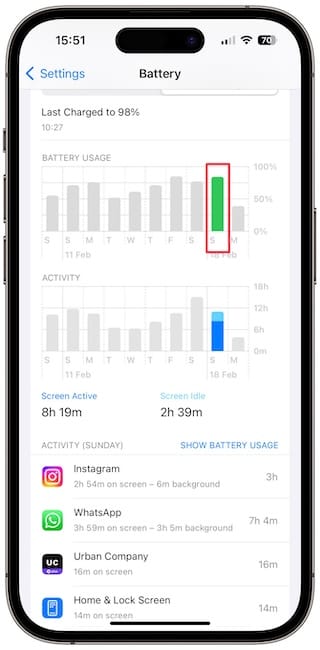
You can tap on a day to filter out everything and see the battery use, screen on time, screen idle time, and app that used battery for that day. Tap on the bar again to get back to the overall view.
Prolong the battery life of your iPhone
In the Battery settings page, you will see a Battery Health & Charging section. Tap to open it. The first thing you will see is the current Maximum Capacity of your battery. A brand-new iPhone has a battery capacity of 100%. As the battery goes through discharge and charge cycles, it slowly starts to lose its maximum capacity.
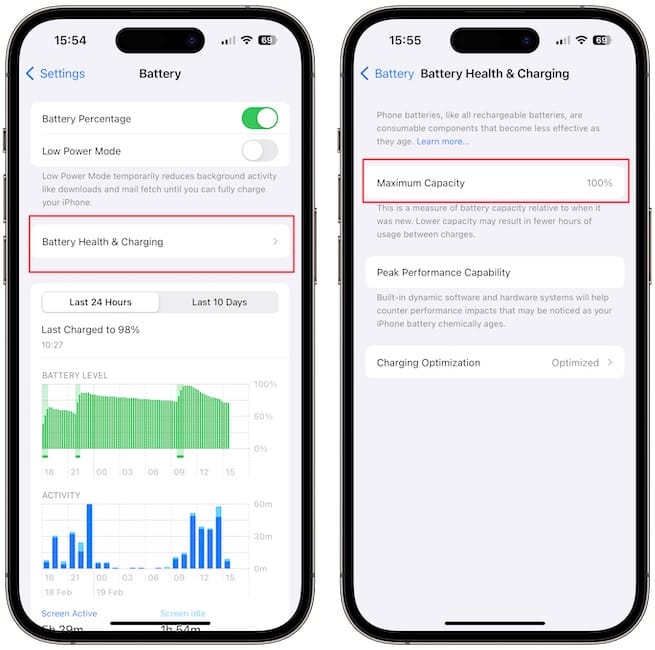
Apple recommends users get the battery replaced when the maximum capacity falls below 80%. If you feel that your iPhone’s battery is not lasting long enough or it’s giving a sub-par performance, it might be because your iPhone’s battery capacity might have fallen below 80%. Replacing the battery will fix the issue.
Now, tap to open the Charging Optimization page. On this page, tap to select the Optimized Battery Charging option. When you turn on this option, your iPhone learns your charging behavior and waits to finish the last 20% of your battery just before you need it. This ensures that your iPhone is not plugged in at 100%.
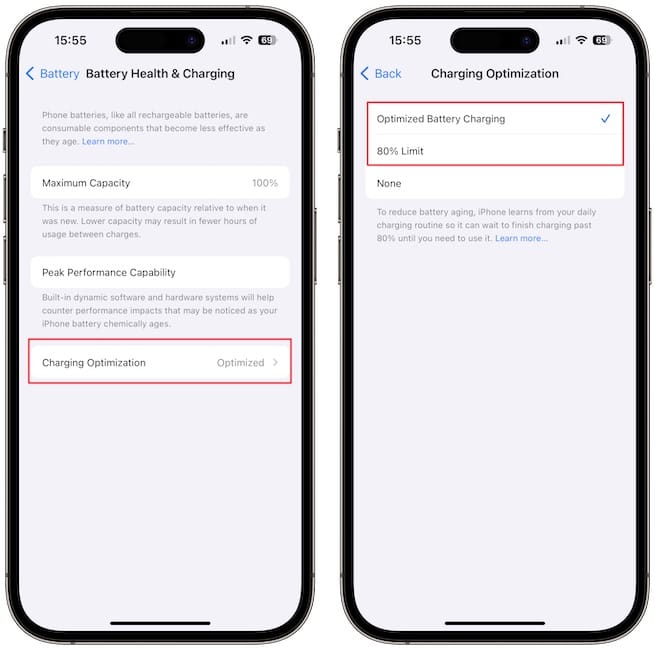
If you want you can restrict the battery charge to 80% capacity, but I don’t think anyone should use this option. Yes, it might prolong the battery life, but you are only using 80% of the total battery since the start, which doesn’t make any sense.
iPhone battery graph explained
We hope you can now read the battery graph of your iPhone and understand what it means. If you have questions regarding this, let us know in the comments, and we will help you. You can also follow us on YouTube if you want to see the video guide.